2019年IOAA数据分析第1题
英文题目
1. Photometry and spectroscopy of Nova Del 2013 (60 p)
Classical nova V339 Del (Nova Delphini 2013) was discovered by Koichi Itagaki at 6.8 magnitude on 14 August 2013 at 14:01 UT (MJD = 56518.584). Both professional and amateur astronomers analysed the photometry and spectroscopy of the nova. Less than 10 hours after the alert, when the night falls at the Piszkéstető Mountain Station of the Konkoly Observatory of the Hungarian Academy of Sciences, Hungarian astronomers took the first spectrum data of the nova using the eShel echelle spectrograph in the Gothard Astrophysical Observatory of Loránd Eötvös University attached to the 1 meter telescope of the Konkoly Observatory.
Refer to Fig 1.1 and Fig 1.2 to complete the questions. The larger versions of Fig 1.1 and Fig 1.2 are found on separate A3 papers.
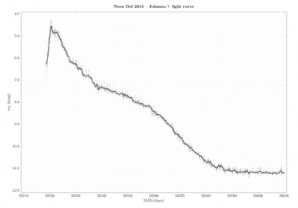
Fig. 1.1 shows the visual light curve of the nova based on the data downloaded from the website of AAVSO (American Association of Variable Star Observers). On the horizontal and vertical axes, the Modified Julian Date (MJD = JD−2 400 000.5) of the observations and the Johnson V magnitudes are plotted, respectively. The grey circles (about 38000 data points) represent the measured values, while the continuous black line is the result of smoothing the data with a Gaussian filter (Full Width at Half Maximum = 0.5 day) to define an "average" light curve from the data points.
The rate of decline can be characterized by the values 𝑡2 and 𝑡3, which show the time interval in days in which a nova fades from its maximum brightness by 2 and 3 magnitudes.
A few empirical formulae between the peak of the absolute magnitude in the V band (𝑀0) and 𝑡2, 𝑡3 values can be found in the following literature:
(a) 𝑀0 = −7.92 − 0.81arctan ^(1.32−log𝑡2/ 0.23 )(Della Valle, M. & Livio, M.: 1995, ApJ 452, 704)
(b) 𝑀0 = −11.32 + 2.55log𝑡2 (Downes, R.A. & Durbeck, H.W.: 2000, AJ 120, 2007)
(c) 𝑀0 = −11.99+ 2.54log𝑡3 (Downes, R.A. & Durbeck, H.W.: 2000, AJ 120, 2007)
The 𝐸(𝐵 − 𝑉) color excess of Nova Del 2013 (Chochol, D. et al.: 2014, Contrib. Astron. Obs. Skalnaté Pleso 43, 330) is:
𝐸(𝐵 − 𝑉) = 0.184 ± 0.035
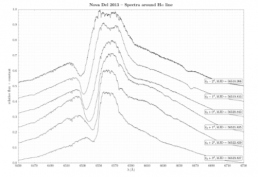
Fig 1.2 shows the nova spectra taken in the wavelength region around the Hα line on six consecutive nights before and after the time of the maximum brightness (𝑡0). The individual spectra have been shifted vertically for clarity. The Modified Julian Dates (MJD) of the observations are listed on the right hand side of each spectrum slice.
The Hα line shows the so-called P Cygni profile with very broad wings, which is typical not of novae only, but is present in almost all spectral types and is a reliable sign of a massive radial motion of matter ejected from the star. The P Cygni profile is composed of a strong, broad emission peak which is considered to be centered at the rest wavelength in air 𝜆0 of the line – for Hα 𝜆0 = 6562.82 Å – and a usually weaker, blueshifted absorption component. The expansion (radial) velocity of the shell can be approximated from the measured wavelength 𝜆 of the absorption peak using the well known Doppler formula connecting the displacement ∆𝜆 = 𝜆 − 𝜆0, the radial velocity 𝑣r, and 𝑐, the speed of light.
Assume that the Hα line showing P Cygni profile is excited in the outermost part of the spherically expanding shell, and its extent at the moment of taking the first spectrum was still negligible.
a) From Fig. 1.1, estimate the Modified Julian Date of the peak magnitude (MJD0) and the value of the peak magnitude itself. Consider the error of this brightness value to be 0.05m. (3 p)
b) Estimate the Modified Julian Dates based on the time interval (days) in which the nova has faded by 2 and 3 magnitudes, then calculate 𝑡2 and 𝑡3 values. (6 p)
c) With reference to 𝑡2 and 𝑡3 from (b), determine the peak absolute magnitude of the nova using all three empirical formulae listed earlier, calculate their mean (𝑀0) and their standard deviation, and consider this latter as the uncertainty of 𝑀0. (5 p) The formula for standard deviation:
𝜎 = √ ∑ 𝑛 𝑖=1 (𝑥𝑖 − 𝑥̅) / 𝑛 − 1
d) Using the value of the color excess 𝐸(𝐵 − 𝑉), determine the interstellar extinction 𝐴𝑉 and its uncertainty in the direction of the nova. Use 𝑅𝑉 = 3.1, without error. (4 p) e) Estimate the distance to the nova and its uncertainty. Give the result in kpc. (11 p)
f) Measure the central wavelengths of the P Cygni absorption features plotted in Fig. 1.2 (refer to magnified version), and calculate the corresponding radial velocities. No error estimation is needed. (14 p) g) Plot these radial velocities against the Modified Julian Dates of the observations. (6 p)
h) From the graph in (g), estimate the physical radius of the envelope at the end of the time interval. Give the answer in astronomical units (au). (7 p)
i) Knowing the distance to the nova and the physical radius of the spherical envelope 5 days after the discovery, estimate the apparent angular diameter of the envelope then. (4 p)

