2018年IOAA数据分析第2题-双星系统中的致密天体
(D2) Compact Object in a Binary System [75 points]
Astronomers discovered an extraordinary binary system in the constellation of Auriga during the course of the Apache Point Observatory Galactic Evolution Experiment (APOGEE). In these questions, you will try to analyse the data and recreate their discovery for yourself.
The research team is aiming to find compact stars in binary systems using the radial velocity (RV) technique. They examined archival APOGEE spectra of “single” stars and measured the apparent variation of their RV within this data. Among ~200 stars with the highest accelerations, researchers searched for periodic photometric variations in data from the All-Sky Automated Survey for Supernovae (ASAS-SN) that might be indicative of transits, ellipsoidal variations or starspots. After this process, they spotted a star named 2M05215658+4359220, with a large variation in RV and photometric variability.
2.1. The following table presents the radial velocity measurements of 2M05215658+4359220 during three epochs of APOGEE spectroscopic observation. Here we assume the variation of its RV is due to the existence of an unseen companion. The proper motion of the stars can be ignored.
| Observation | MJD | RV(km·s-1) | Uncertainty(km·s-1) |
|---|---|---|---|
| 1 | 56204.9537 | -37.417 | 0.011 |
| 2 | 56229.9213 | 34.846 | 0.010 |
| 3 | 56233.8732 | 42.567 | 0.010 |
(D2.1.1) (6 points) Use the data and a simple linear model to obtain an initial estimate of the apparent maximum acceleration of the star:
$$ a_{\max }=\left.\frac{\Delta R V}{\Delta t}\right|_{\max }, \text { unit: } \mathrm{km} \mathrm{s}^{-1} \mathrm{day}^{-1} $$
(D2.1.2) (9 points) Now use theorb data to obtain an initial estimate of the mass of its unseen companion.
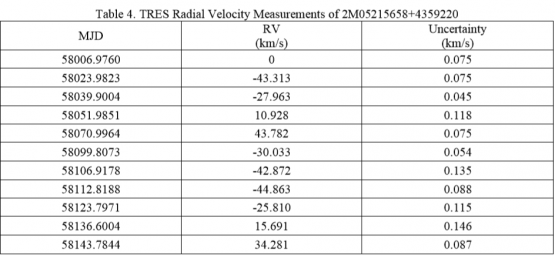
2.2. After discovering this peculiar star, astronomers conducted follow-up observations using the 1.5-m Tillinghast Reflector Echelle Spectrograph (TRES) at the Fred Lawrence Whipple Observatory (FLWO) located on Mt. Hopkins in Arizona, USA. The following table presents the RV measurements using this instrument:
(D2.2.1) (14 points) Plot the diagram of RV variation (measured with TRES) versus time on your graph paper and label it as Figure 4. Draw a suitable sinusoidal function to fit the given data. Estimate the orbital period (𝑃orb) and radial velocity semi-amplitude (𝐾) from your plot.
(D2.2.2) (4 points) If the star is moving in a circular orbit, calculate the minimum value of the orbital radius (𝑟orb) of the star in units of both 𝑅⊙ and au.
(D2.2.3) (7 points) The mass function of a binary system is defined as:
$$ f\left(M_{1}, M_{2}\right)=\frac{\left(M_{2} \sin i_{o r b}\right)^{3}}{\left(M_{1}+M_{2}\right)^{2}} $$
where the subscript “1” represents the primary star and “2” represents its companion. The parameter 𝑖orb is the orbital inclination of the binary system. This mass function can also be expressed in terms of observable parameters. Calculate the mass function of this system in units of 𝑀⊙.
2.3. Based on a detailed analysis on APOGEE, TRES spectra and GAIA parallax measurements, astronomers derived the following stellar parameters:
| Effective Temperature
Teff(K) |
Surface Gravity
log 𝑔(cm·s-2) |
Parellax π
(mas) |
Measured Rotation
Velocity vrot sin i (km·s-1) |
Bolometric Flux
F(J·s-1·m-2) |
|---|---|---|---|---|
| 4890 ± 130 | 2.2 ± 0.1 | 0.272±0.049 | 14.1±0.6 | (1.1±0.1)×10-12 |
Photometric observations indicate that the period of its light curve is identical to its orbital period, thus we may assume that the rotation period satisfies 𝑃rot=𝑃orb≡𝑃, and the inclination satisfies 𝑖orb=𝑖rot≡𝑖.
(D2.3.1) (16 points) Calculate the luminosity (𝐿1, in unit of 𝐿⊙), radius (𝑅1, in unit of 𝑅⊙), sine of the inclination angle (sin𝑖), as well as mass (𝑀1, in unit of 𝑀⊙) of the visible star. Please include the uncertainty in your results.
(D2.3.2) (4 points) Choose the correct type of this star from the following options: (1) Blue Giant (2) Yellow main sequence star (3) Red Giant (4) Red main sequence star (5) White Dwarf.
(D2.3.3) (10 points) Based on the mass function 𝑓(𝑀1,𝑀2) of the binary system, plot the rough relationship of 𝑀( (as vertical axis) and 𝑀1 (as horizontal axis) on your graph paper and label it as Figure 5. Plot the most probable relation (by using sin𝑖), upper limit (with sin𝑖+𝛥sin𝑖) and lower limit (with sin𝑖−𝛥sin𝑖) derived in (D2.3.1).
(D2.3.4) (5 points) Draw a vertical shadowed region of [𝑀1−𝛥𝑀1,𝑀1+𝛥𝑀1], as well as two horizontal dashed lines showing the maximum mass of the white dwarf and neutron star, on your Figure 5. What is the possible mass of the invisible companion, and what kind of celestial object could it be?
